Making Physical Representations of Data
Teacher(s)
Goals
Designing and creating physical objects encoding complex data and communicating information
Institution and classes
IGD (IPP), Ingénieur (Telecom), Recherche en design (ENS)
Duration
24h of classes and 48h of autonomous work
Theoretical and practical grounds
Data analysis, data visualization, data physicalization, digital manufacturing
Equipment
Studio Design, Fablab, hand tools, any type of materials
Knowledge to acquire
History of the links between data, communication, the use of representations (including visual representations), and the design of physical objects. Bases of the physical and cognitive processes involved in visual perception and processing (identifying similarities, differences and variations, evolutions, and relationship between visual elements)
Skills to develop
- Collecting and analyzing data (its nature and structure)
- Designing representations and objects (mapping the data to visual and physical properties)
- Methods of design thinking, information design and object design
Presentation of some productions
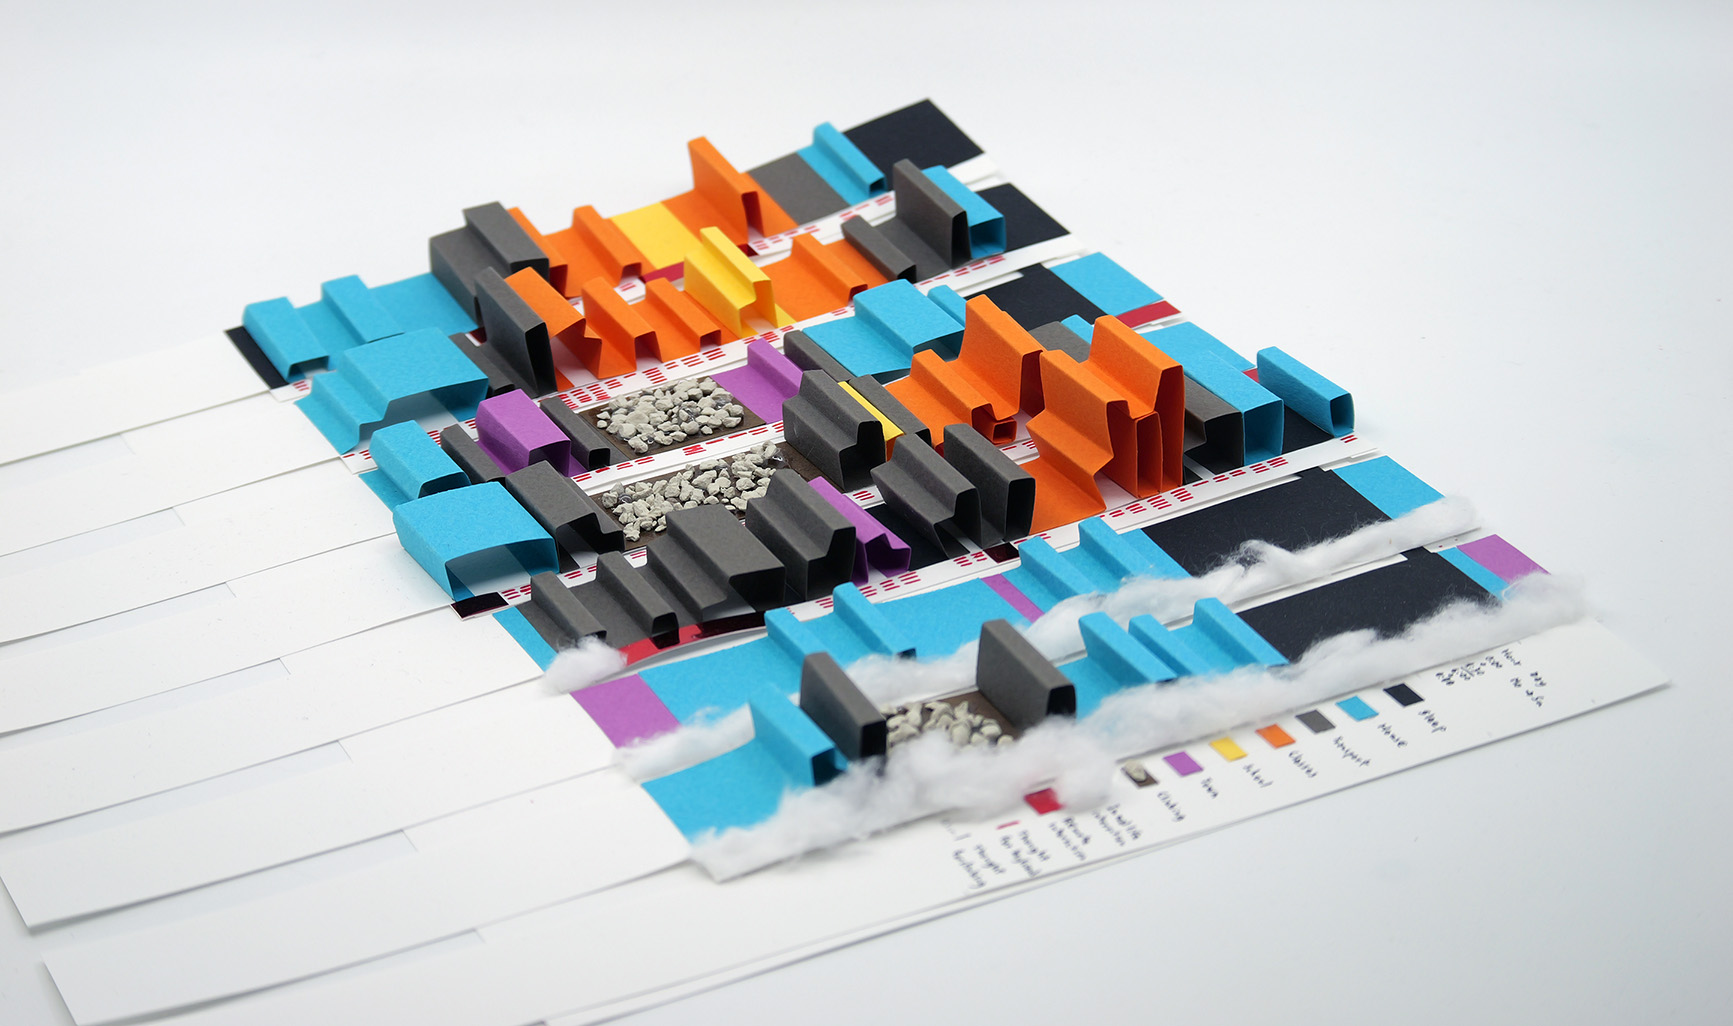
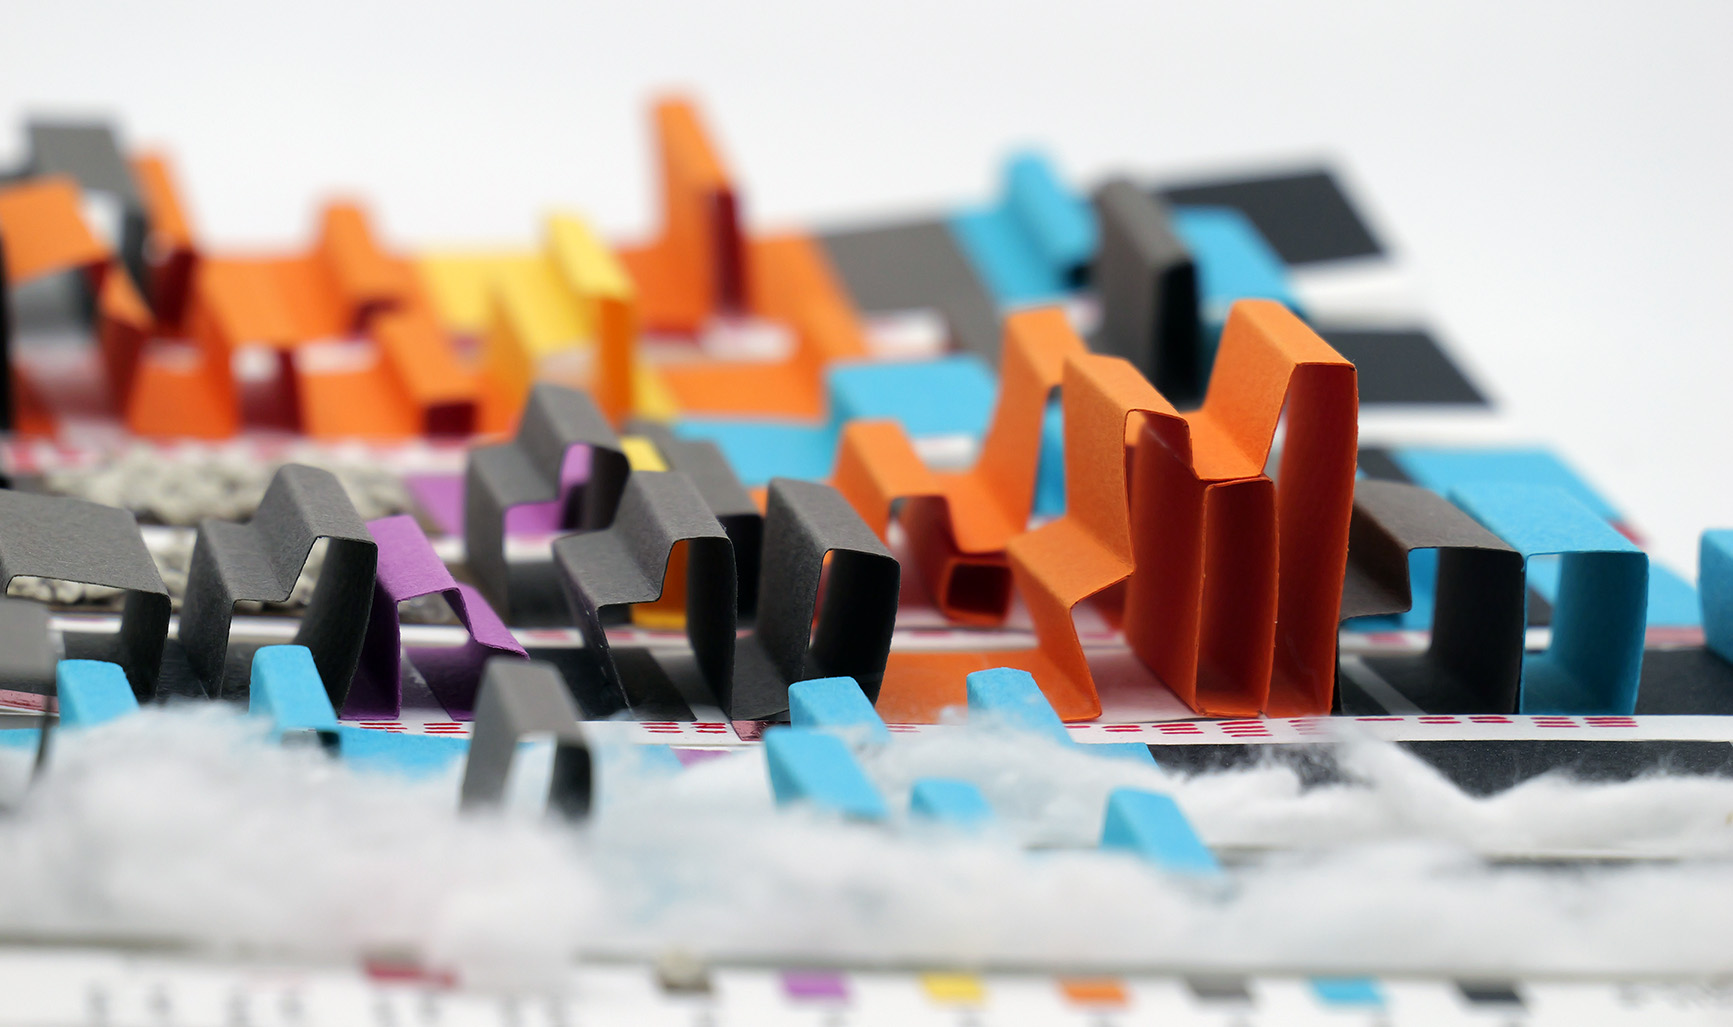
Aude Bouillé worked on questioning and representing how her activities and thoughts articulate everyday.
Goal : Taking advantage of physical representations to communicate the various activities she practices in her life, and the time she spends thinking of the most important topics for her, during all of these activities
Position : Using simple materials and composition to communicate complex information
Proposition : Using colors, textures, materials, position, height (by folding paper) and color strokes
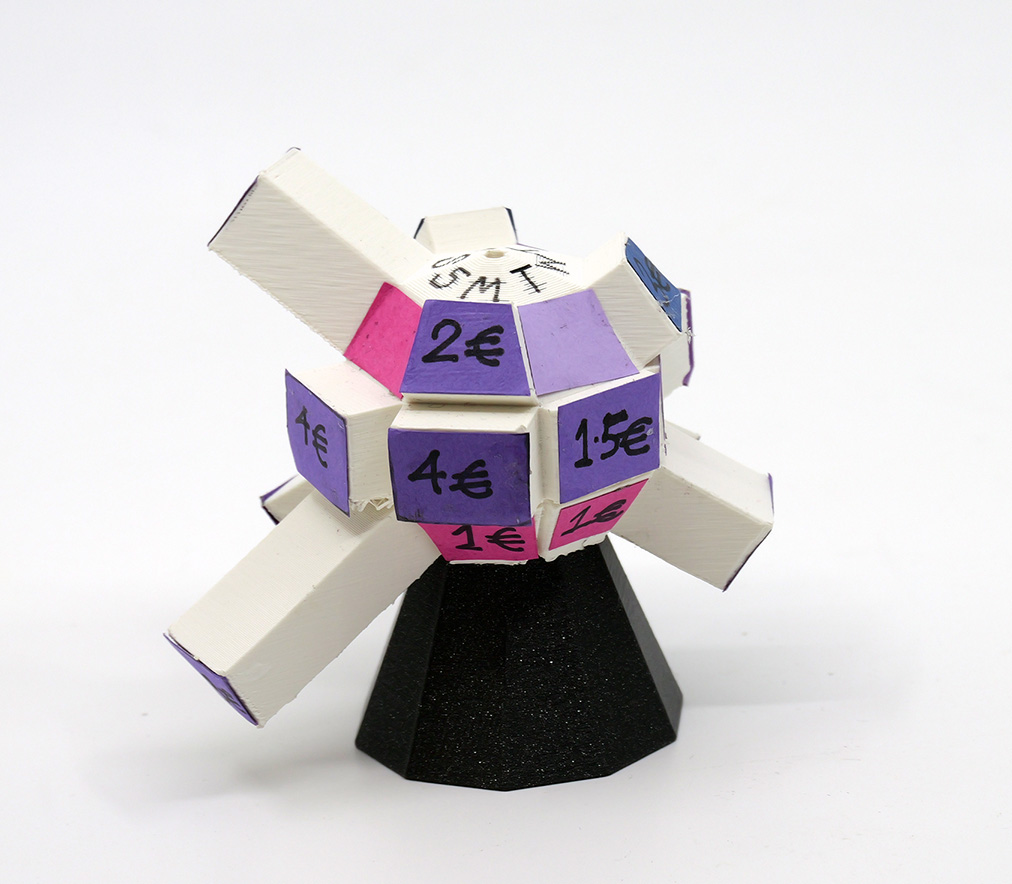
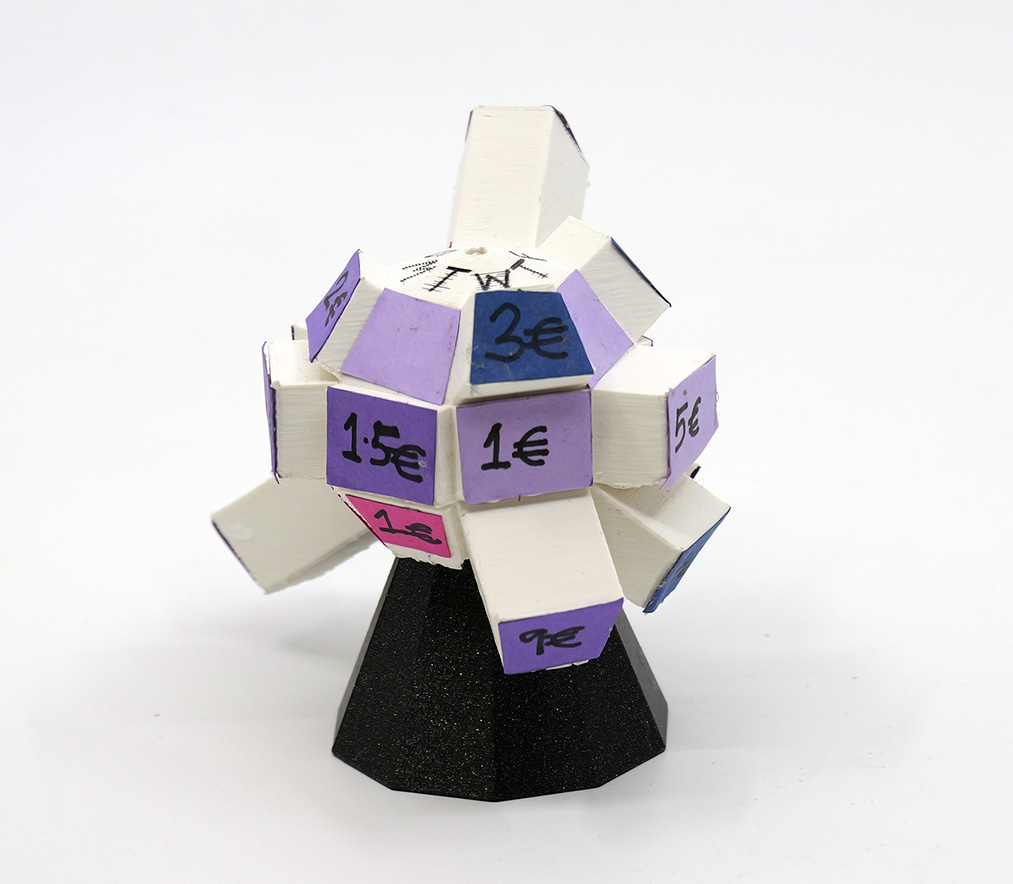
Srijan Sarkar worked on exploring his food consumption patterns, and their impact on his life.
Goal : Representing eating patterns, the price of the meals, and the mood after each meal
Position : Using 3d printing methods and the 3d shape of the "UV sphere", to include all data into an hand-sized object that is easy to grab and transport
Proposition : Using colors (mood), height and text (prices)

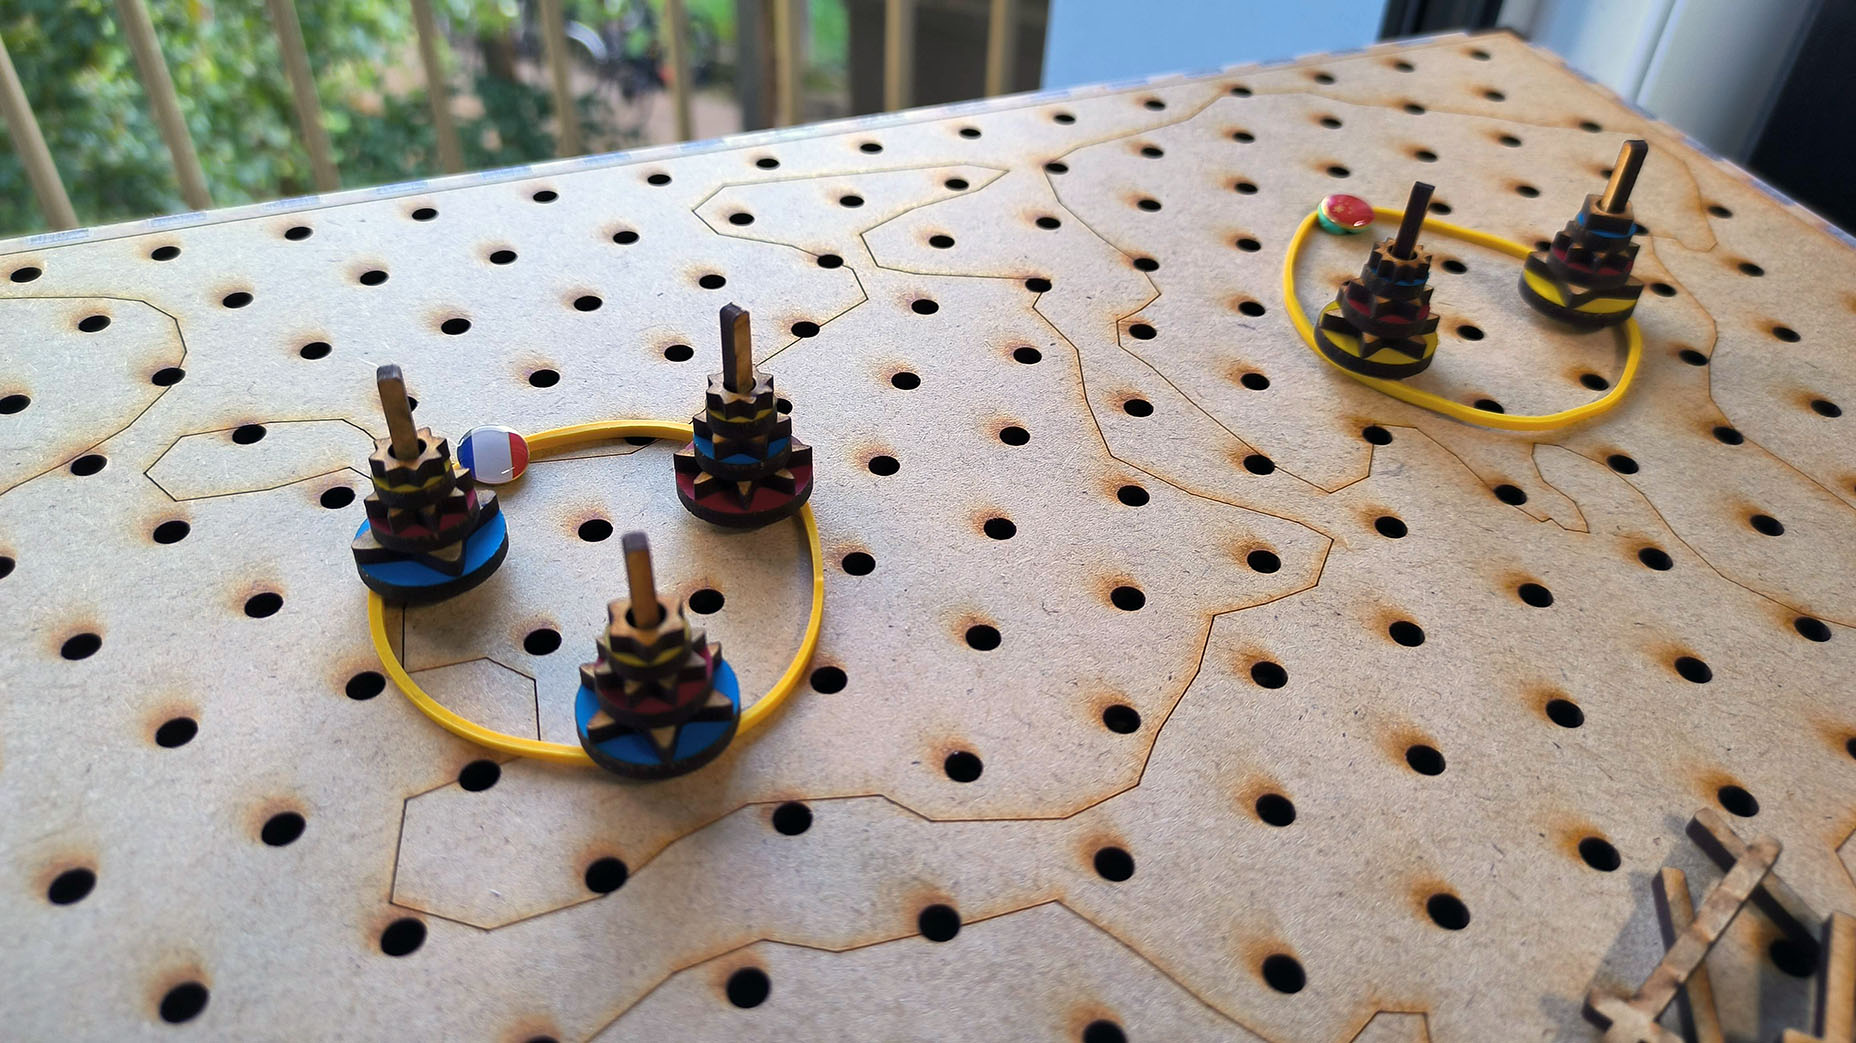
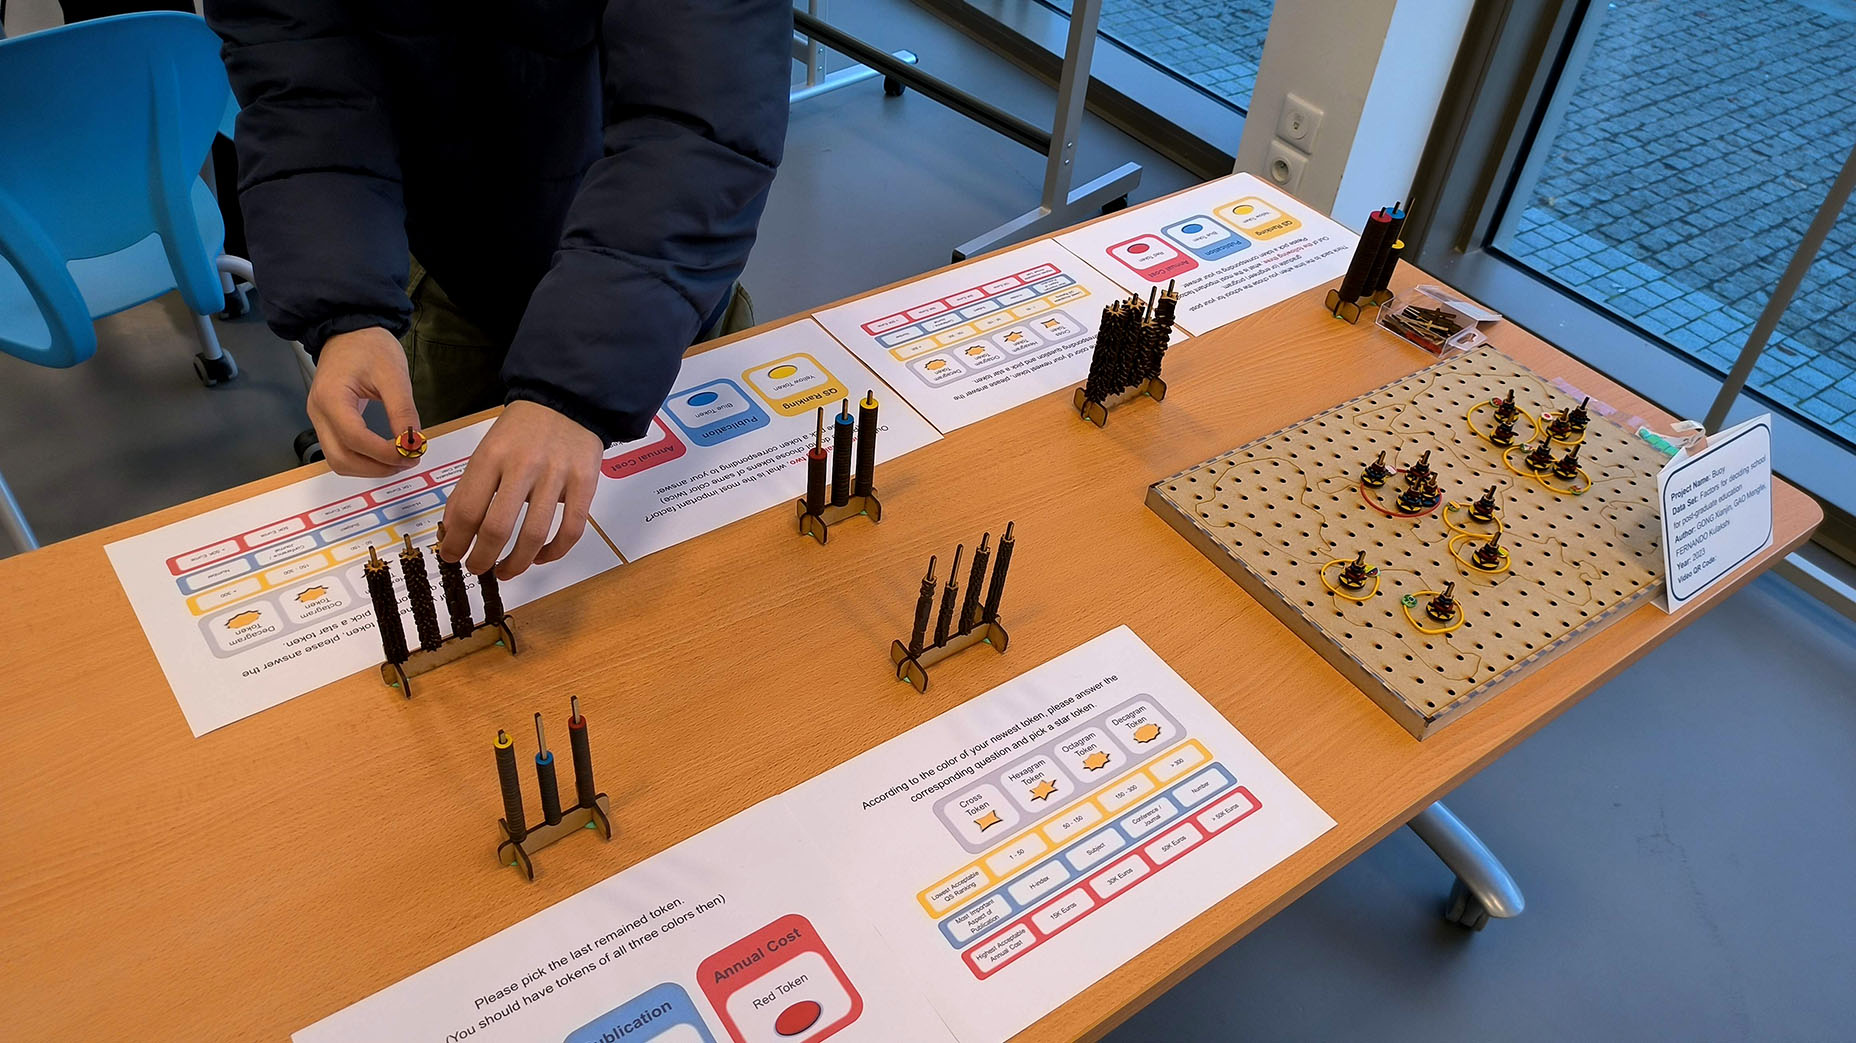
GONG Xianjin, GAO Mengfei and FERNANDO Kulakshi worked on questionning and representing how people from different countries decide where to pursue their post-graduate education.
Goal : The team has been inspired by the design of a research project (Cairn by Gourlet et al.) and improved it to create a physicalization that can communicate complex information, provide it at one glance, and present more organized data
Position : Designing a board (lasercut in the fablab) to encourage people to provide information about their choices, as if they were playing a game
Proposition : Combinations of colors and shapes to communicate complex information. For example if the cost (red) is the most important aspect of choice, then the shapes will mean from "300€" to "> 50k€". However, if the most important aspect is the publications of the lab (blue), then the shapes will express whether the main focus is on the h-index, the number of publications, etc.